The Pane Info
Mac
The sub-item Mac lists technical details about the current computer system. This includes data not accessible by the System Information application of macOS.
The section Computer contains the name of the system as you have defined it (which may not be identical to the name used to identify this computer in the network), Apple’s official model name (also known as marketing name), a short description of this model series, the Apple model identifier which is the code Apple and macOS internally use to identify this series, the computer’s serial number, its unique hardware identification, and the week of production. If you are using a Macintosh model available in different colors, a small color field next to the line with the model identifier shows the color of the enclosure. A typical image of the computer model is also shown at the top above the text.
For Apple devices manufactured after August 2021, Apple may no longer permit that the actual manufacturing date can be determined. In this case, TinkerTool System will indicate this with a respective message.
If your Mac is based on an Apple Silicon processor, Apple’s short description text for the model series won’t be available, but the following information is added instead:
- the Apple order number of this Mac,
- the model code of the enclosure.
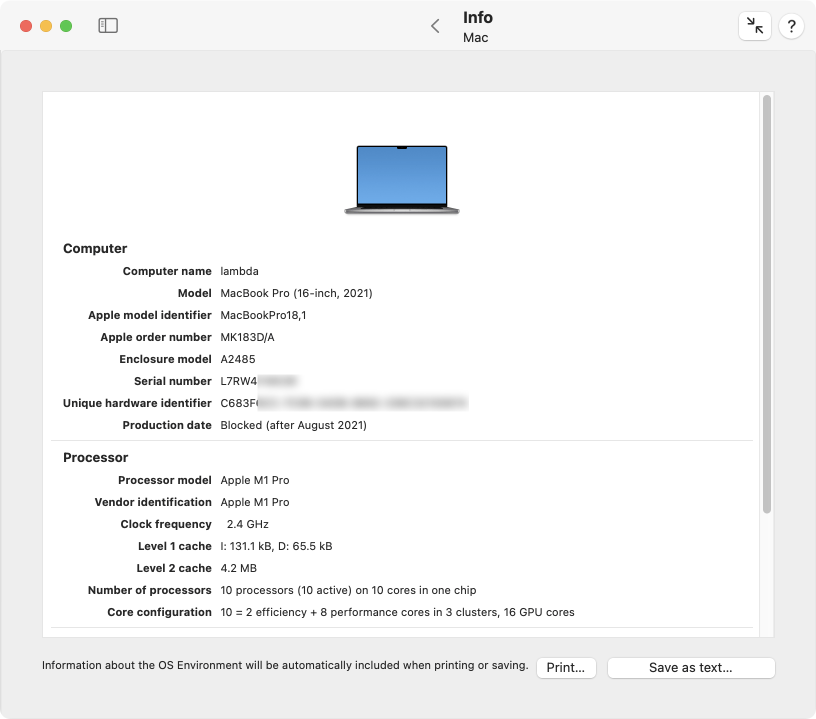
The second section Processor lists details about the processor configuration, as well as the available cache sizes. This includes the official processor model identification, the vendor identification, the number of processors, the number of available processor cores and active cores.
For Intel processors, the information whether each core is capable of executing multiple threads of instructions (Simultaneous Multi-Threading) follows. If active, the hardware will simulate twice the number of processors. In addition, you will find the processor generation specifier for x86 systems, which includes the family number, model number, stepping number (hardware version), and the decimal signature which compresses all identification codes into one single number.
Intel processor generation data is naturally unavailable for Macs with Apple Silicon processors. Here, you will find the exact configuration of processor cores instead: The number of efficiency cores, high-performance cores, their distribution on processor clusters, and the number of Apple GPU cores.
Also listed are the processor’s main clock frequency, the sizes of the level 1 caches (I for instructions, D for data), and the sizes of the level 2 and level 3 caches (Intel only).
The section Memory shows the size of physical memory (Random Access Memory, RAM) currently built into your computer and the optimum free size. This size specifies the small amount of physical memory the operating system should try to keep free for best performance. The optimum is reached when no RAM is wasted (nearly everything is in use), but a small remainder is left free for current handling. The line Addressable memory defines the size of physical and virtual memory the processor can internally manage. This does not mean that this amount could actually be used in practice. The number of slots available for memory modules and other limitations of the computer’s chipset will reduce these theoretical values. For more information on memory management, please also see the section Introduction to virtual memory.
The fourth section Logicboard contains detail data about the computer’s main logic board, namely the vendor information, its internal model code, and its serial number. Macs based on Apple Silicon don’t use a visible model code for the logicboard and the corresponding line will be omitted in this case.
Additional data for Intel-based Macs
These items cannot be retrieved if you are using a Mac with Apple Silicon. SMC and bridge are part of the main processor, so they no longer need to be separate parts. System management data compliant with the SMBIOS standard is no longer supported. Instead, product records are available. Please see the next section for more information.
The fourth section also shows the version number of the System Management Controller (SMC) and its firmware. The SMC is an auxiliary processor which manages the computer’s internal sensors and its power management features. It operates the “always-on” parts of the system, still running when the actual computer is in sleep mode or shut down. It is also responsible to identify the computer as genuine Apple-branded product, constituting the main difference between a generic personal computer and a Macintosh.
A special detail sheet, available via the button Show management records lists technical information which has been stored into the management memory of the computer. It includes:
- data about the system unit
- detail information on each processor
- detail information on each cache unit
- detail information on each memory slot or memory device
- a description of the system’s firmware
- management data about the system board
- management data about the system enclosure
- detail information about each connector on the system board or system enclosure
- detail information on each expansion slot
- list of built-in system devices
- list of jumpers and switches on the system board.
These management records are not computed by TinkerTool System but only retrieved by it. They have been stored by the manufacturer into the so-called System Management BIOS area of the system’s firmware when the computer was assembled. Some parts are also computed dynamically by macOS by retrieving the necessary data from the available hardware.
Another detail sheet BridgeOS Info is available if your computer is equipped with Apple BridgeOS Processor technology. This can either be the original iBridge system or the Apple T2 Security Processor. The BridgeOS system is a secondary computer built into your Mac which controls security features such as the TouchID fingerprint sensor or SSD encryption, depending on model. This auxiliary system runs its own operating system Apple BridgeOS and may always be on if power is available. The entry Apple BridgeOS Processor indicates whether such technology is used in your Mac. If yes, you can press the BridgeOS Info button to learn more details about its configuration.
Additional data for Macs with Apple Silicon
Instead of SMBIOS data, Macs with Apple Silicon store Apple product information internally. The most interesting items will be listed after clicking Show product records:
- the type of System on a chip (SoC) used in this Mac,
- the Macintosh compatibility level, which is basically a virtual Mac that defines a certain set of features. For example, a “generation 15” Mac may support more modern features than a “generation 14” Mac, and omit certain outdated features. The level defined by the first Apple Silicon Macs that were published in 2020 is called “generation 20”.
- the Mobile device compatibility level: similar to the previous item, it defines a set of capabilities this Mac has when it falls back to be used like one of Apple’s mobile devices, usually an iPad Pro.
- the number of built-in microphones, which defines how many audio sensors are built into this Mac.
- Memory upgradable: an indicator whether RAM can be upgraded in this Mac or not.
- Touch Bar serial number: if this Mac has a Touch Bar or finger print sensor unit, the serial number of the part which has been paired with this computer.
- Ambient light sensor serial number: as before, but referring to the light sensor unit.
- Cover glass serial number: as before, but referring to the cover glass of the display.
- Display assembly part and serial numbers: if this Mac has a built-int display, the serial numbers and/or part numbers of all components that comprise the display. The cover glass may be included in this list.
- Power Supply: Specific Mac series allow access to data about the internal power supply unit. If you are using such a Mac model, the tab Power Supply will be shown additionally. It lists technical details such as manufacturer, model type and serial number, as well as nominal secondary voltage, maximum amperage and power. This feature is usually available if the Mac is internally designed like a “portable computer without battery”.
It is possible to either print the contents of the main information window, or to save it into an HTML-based text file. Such documents can be used to automatically generate inventory records for all your computers. Click the buttons Print… or Save as text…, respectively. Created text files can be opened by any web browser or by the TextEdit application included with macOS.
In addition to the Mac data, other information from the sub-item Operation Environment (see next section) are included in the printed report as well.
The startup time of the system is a volatile item that is not included in text reports.
Operation Environment
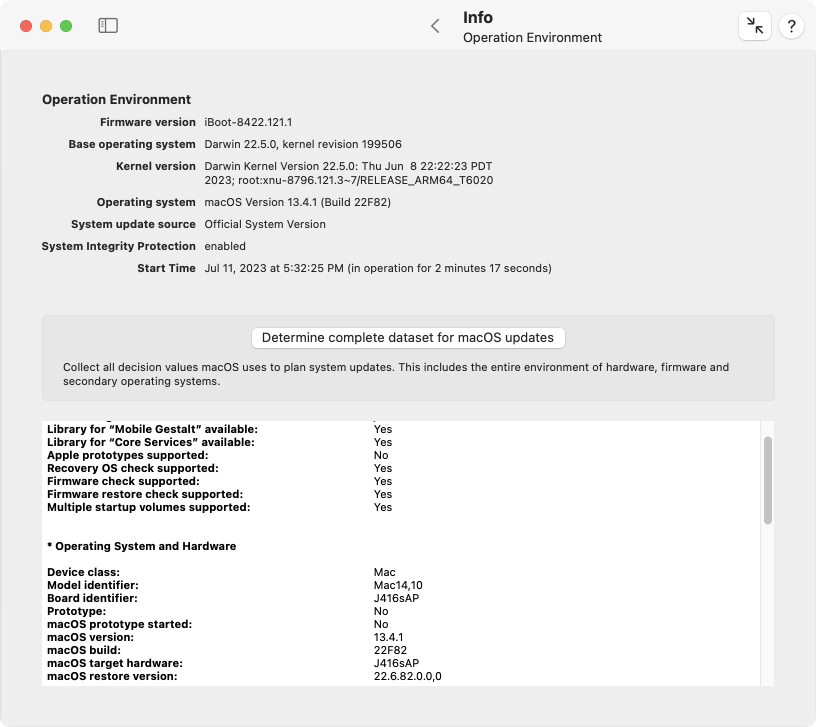
The item Operation Environment summarizes the version information about the computer’s firmware, the Darwin operating system on which macOS and iOS are based, the kernel version and revision codes, as well as the operating system version and build numbers. The line System update source indicates whether you are using an officially released version of the operating system, or whether your computer is set up to receive updates from one of Apple’s pre-release distributions (seeding programs).
Note that the field reflects participation in one of the pre-release update programs, not the status of the currently running operating system. Usually, both specifications are equivalent, but if you have not carried out a pending update yet, there will be temporary differences.
This section also shows the computer’s hardware setting for System Integrity Protection that is currently taking effect for the operating system. (For information on the technical background of this feature, please see the end of the chapter Basic Operations.) The feature can either be fully enabled, completely disabled, or enabled partially. In the partial case, TinkerTool System uses the following abbreviations to indicate which operations are permitted by the current computer settings:
- kext: untrusted kernel extensions can be loaded into the system kernel.
- fsac: the system has permission to modify or delete objects in the file system for which the attribute restricted is set.
- tpid: the system has permission to use features that determine which process is belonging to a specific process identification number.
- kdbg: kernel debugger features can be used.
- appl: the system has permission to use functions which are considered Apple-internal.
- trac: the system has permission to use program execution tracing (based on dtrace technology) without limitations.
- pram: the system has permission to modify all entries in the non-volatile RAM (NVRAM).
- devc: device configuration is permitted.
- reco: the computer has permission to use any of the available recovery operating systems.
- akex: the system can load trusted third-party kernel extensions which are not approved by an administrator yet.
- expo: the system has permission to override the security policy for executable applications.
- stur: the operating system can start from an unauthenticated root file system which has not been cryptographically sealed by Apple.
All protection items not listed by TinkerTool System are in full effect. The exact meaning of these settings is defined by Apple and can be changed without notice.
The last line of the overview shows the start time of the operating system, both as absolute time and as interval that has passed since then, the so-called uptime.
If you press the Determine complete data set for macOS updates button, TinkerTool System collects further information, namely the entirety of all decision data that macOS uses when it searches for system updates. This includes the hardware, the firmware, the running operating system and all auxiliary operating systems, such as bridge systems, start systems, recovery systems. The data is shown in tabular text form and is usually self-explanatory.
This data may not be available if the computer has been running for an extended time without restarting it. A restart fixes this issue.
Malware Protection
macOS offers multiple built-in security measures against malicious software (malware). One of these security features works like a virus scanner which automatically scans downloaded files, searching for known code patterns (signatures) in the background. Apple refers to this technology as Safe Downloads List. It is also known under the name XProtect. Its function is enabled by default. The virus signatures are automatically updated when the option Install Security Responses and System files is enabled at General > Software Update > Automatic Updates > i in System Settings. In addition to detecting malicious software, this component also monitors the version numbers of specific Internet plug-ins installed in the system. Such plug-ins are used by Internet browsers to support optional web technologies like Adobe® Flash® or Java™.
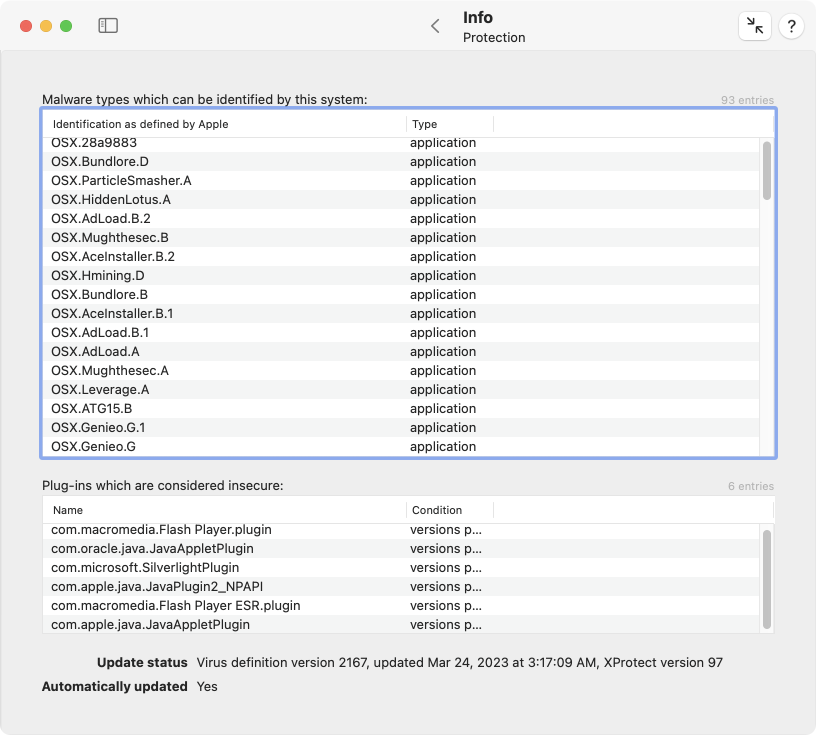
By use of the sub-item Protection, you can review the current contents of the Safe Downloads List. The upper table shows the malicious programs which can be recognized by the operating system at the moment. The name of the malware, as defined by Apple, and the file types used for the distribution of the software are listed.
The lower table lists the Internet plug-ins which are monitored by the operating system, checking them for outdated versions. The name of each plug-in and the versions which are considered to be critical are shown.
Below the tables, TinkerTool System displays when Apple has revised the list for the last time, when the list has been transferred to this computer, and whether the system checks automatically if a new version of the list is available. The version specifications differentiate between the malware definitions and the software XProtect for malware handling.
Please note the following points:
- The tables show which threats can potentially be detected by the operating system. They give no indication if this computer had encountered such malicious software in the past or had removed it. So if there is an entry abc in one of the tables, this will only indicate that macOS would detect the component abc, but it doesn’t mean that abc is currently on your system.
- Entries in the table can be repeated multiple times, in cases where the malware appears in different variants with different signatures, but Apple decided not to give each version its own name.
- Names in the columns can vary, depending on which version of macOS you are using and which other programs are available on your computer. For example, an internal, technical designation could be listed, an English name, or a name in the primary language you have currently selected.
App Deny List
After you open the sub-item App Deny List, TinkerTool System shows you the operating system’s currently list of known applications that should be excluded from using certain features, or should be prevented from running at all. This list is also updated when the option Install Security Responses and System files at General > Software Update > Automatic Updates > i in System Settings.
Three different types of deny lists are shown on this tab:
- The upper table lists applications which should not use the feature App Nap by default. App Nap is an Apple technology for saving energy at the application level: When the operating system detects that a running program is currently not visible or audible to the user (all its windows are hidden and the application is currently not playing any sounds), and is also not performing any background services (like downloading a file), this program will be slowed down automatically, basically putting it into a certain kind of sleep mode, waking it up only in longer time intervals, checking if there is something to do. Some older software products are not prepared for this technology yet, and won’t work correctly when App Nap becomes active. macOS “knows” the affected applications listed here and automatically disables App Nap for them.
- The middle table lists applications which are known not to work correctly with the High Resolution features of macOS, also known as HiDPI (High number of Dots Per Inch). If you are working with a Macintosh system equipped with a Retina, 4k- or 5k display, macOS will automatically rescale all graphics to make use of the sharp, high-resolution screen. Some older applications don’t work correctly in this mode. If they are listed here, macOS won’t enable Retina functions for them.
- The lower table lists applications which are known not to work at all with the current version of the operating system, or which will even cause technical problems. macOS will refuse to launch or migrate these applications when they are detected on your system.
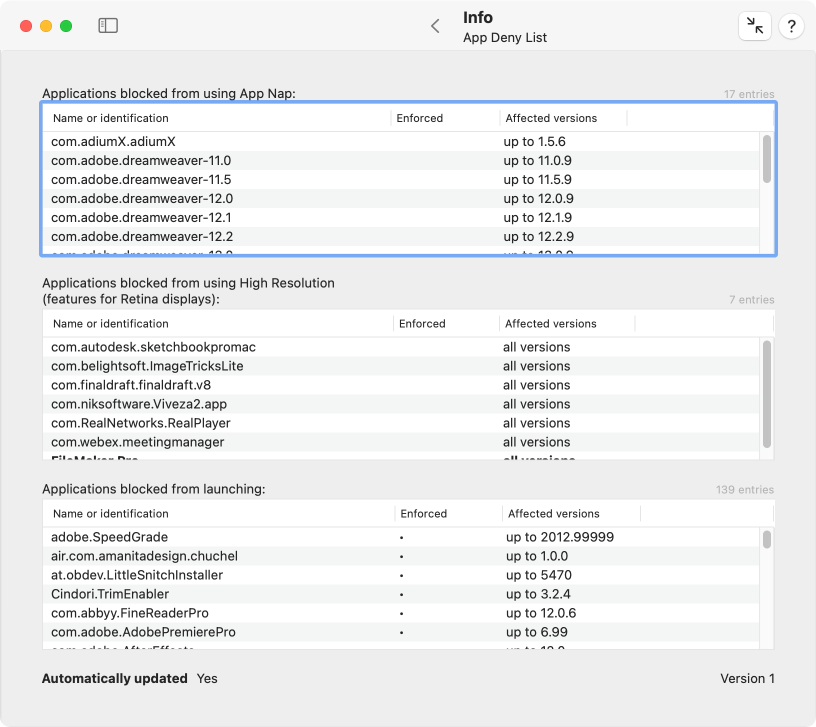
Each table has three columns with the following meaning:
- Name or identification: the name or internal identification code of the application that is listed to be denied. If the affected application is available on your computer, TinkerTool System tries to show the name of the software product in your preferred language. In that case, the whole entry will also be shown in bold print. Programs which cannot be found on your system are shown with their unique identification code only.
- Enforced: If a dot is shown in this column, macOS will strictly enforce blocking the corresponding application. The user cannot override this decision.
- Affected versions: This column identifies the exact application versions for which the deny list entry should become effective. In some cases, only old, outdated versions of a software product should be blocked.
Classic Logs and Reports
After selecting the sub-item Classic Logs & Reports, you will have direct access to a high number of log recordings kept by macOS. The operating system collects notification, warning and error messages in such files, especially for components of the system which don’t have a direct graphical user interface. Administrators can use this information to keep track and analyze problem situations which occurred in the past. The classic logs are simple text files which are filled line by line over time. Most services also note time and date in each line, so it becomes easier to understand the series of events that occurred.
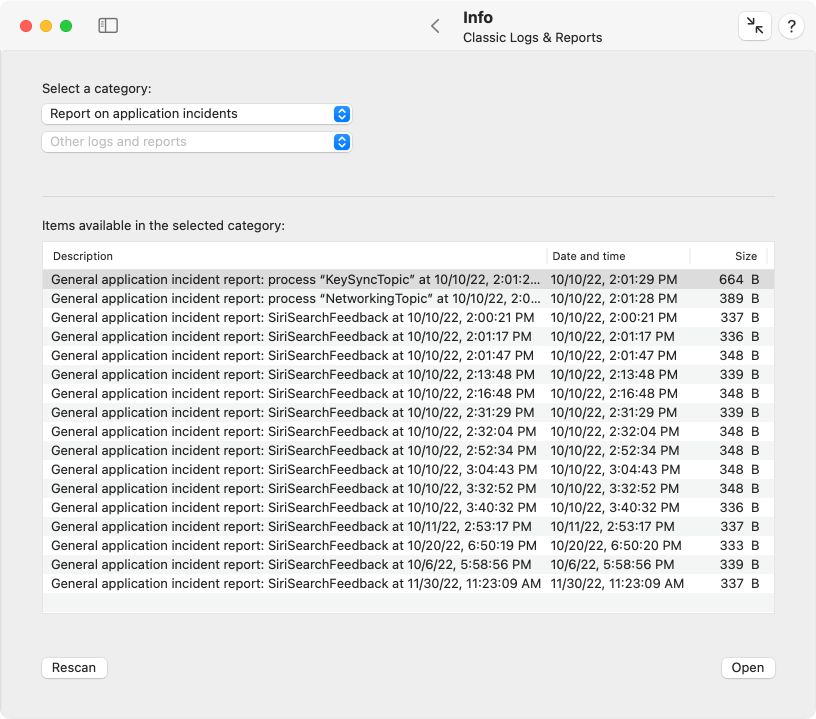
The possibly available logs and reports are accessible via two pop-up buttons. The upper button Standard logs and reports allows you to select the most important log files maintained by macOS:
- System logs: The main system log which collects the warnings and error messages of all running applications.
- Application crash reports: Detail information about all events where an application had to be quit unexpectedly because a serious internal error occurred.
- Application crash reports (iOS style): In 2022, Apple has begun to unify their crash reports across all platforms. macOS is also affected by this, and now usually creates crash reports in a variant which was originally developed for iPhones. Internally, the data is no longer stored as immediately readable report, but in a machine-readable format. TinkerTool System automatically tries to make this as readable as possible.
- Application hang reports: Details about events where an application entered a non-responding state. The affected program hung, i.e. it only performed some internal processing but could no longer react to user activity, like mouse clicks, for example.
- System crash reports: Technical information about events where a serious error was detected by the inner core of the operating system, the system kernel, so the entire computer had to be shut down immediately to avoid damage of data. In older versions of macOS, such an event was also known as kernel panic.
- System emergency power-off: These are reports about events where the user has triggered the emergency power-off feature of the Mac, i.e. an enforced shutdown by keeping the power button pressed for several seconds.
- Apple Silicon issue base reports: Technical information about events where the secondary operating system for the “Always On” part of Macintosh computers with Apple Silicon detected a problem which required a hardware restart. This can include hardware and system management issues.
- Apple Silicon issue full reports: This is a more advanced version of the previous item.
- High CPU activity reports: These reports keep track of incidents where macOS detected that an application consumed a lot of processing power, occupying one or more processor cores for an extended period of time. Those events can be normal for specific types of applications, so the reports may not indicate abnormal activity. The reports can be used to become aware of applications that need more energy than others, which can be interesting on battery-powered mobile computers.
- High application activity reports: The reports on high application activity refer to events where a program was woken up very frequently in a short time frame. Very similar to high CPU activity, these reports are also not critical but help to understand energy usage.
- High memory usage reports: If it makes sense, software developers can define a typical memory usage behavior of their applications. When such an application starts to behave unusual, i.e. it needs more memory than expected, this problem can be reported, or countermeasures can be initiated. For example, the application could try to reduce its memory usage or it could be shut down. These reports keep track of such events and contain the related memory statistics.
- Disk write activity reports: Because most Macintosh computers use flash-based storage, which is subject to wear, Apple collects statistics how many write operations occur on specific storage units. This allows to estimate the remaining lifetime of the flash memory cells.
- Slow response reports: macOS monitors whether applications respond to user interactions such as a key press or a mouse click within acceptable time intervals. If an application is currently too busy to respond to an event quickly enough, or experiences a technical problem, macOS will show a spinning cursor. It will also create this type of report.
- Slow shutdown report: A special kind of slow response is a computer that needs an unusually long time to shut down. To find the cause of such issues, macOS will create a slow shutdown report when such a problem occurs.
- Differential Privacy submissions: Apple devices collect information about how the different products, applications, and services are used. If your privacy settings grant Apple permission to do so, this information is sent to Apple from time to time, anonymizing the data by a technique called differential privacy. Each submission to Apple is logged.
- Apple Wireless Diagnostics report: When the operating system observes specific issues with WiFi operation, it automatically collects diagnostic data about each event. The data may contain private information about networks in the neighborhood. For this reason, the logs are usually encrypted and can only be decoded by authorized Apple service engineers.
- Report on iCloud services: These logs contain diagnostic information and statistical data about communication with Apple’s iCloud services.
- Report on baseband processing incidents: For technical reasons, all operations that convert radio signals to digital data and backwards are collectively called baseband processing. This log category is used to record special events that occur in any of the radio-based components of the Mac, such as WiFi or Bluetooth.
- Report on telephony monitoring: These logs contain information collected by the telephony features of macOS.
- Report on trust checks: Trust checks are used by macOS to assure that a software component is genuine. This usually involves checking a digital signature of executable code and its certificate chain.
- Report on iPhone updates: The system creates a report each time you are using macOS to update iOS on an attached iPhone.
- Report on iPad updates: The same type of report is created for each operating system update of an iPad.
- Proactive events reports: macOS collects statistical data each day how many times Siri could “learn” something new about the user in order to improve its behavior as personal assistant. For example, Siri might have identified a family relationship between the user and another person.
- Report on application incidents: these are general diagnostic reports which are triggered by specific programs when they encounter special internal events, for example an unusually high number of write operations on a disk. It is at the discretion of each application which events are considered special.
The second pop-up button collects Other logs and reports. This includes known activity reports of macOS, e.g. related to the App Store, Disk Utility, the Resume feature, power down monitoring, etc., as well as unknown logs created by third-party applications. In the latter case, TinkerTool System cannot know the exact contents and meaning of the log files in advance, so the respective items are listed with their raw file names in the menu.
For security reasons, logs that may keep potentially confidential or security-critical information cannot be opened by every user. You must be logged in as administrative user to ensure that you are capable of seeing and opening the complete set of log files. TinkerTool System will give you a warning in this respect if you are not using an administrator account.
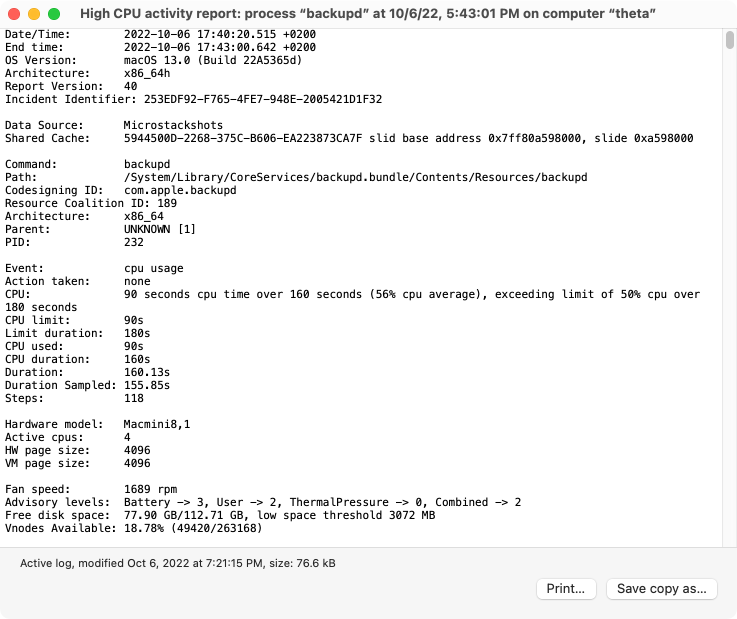
After you have selected a log category with one of the two buttons, the table will give you an overview of the available logs. Each one is listed with a short description, date and time, which usually corresponds with the last entry recorded in the log, and file size. Either double-click a listed entry or click the button Open to open the respective log. A text window will show you the contents of the selected log file. Note that you can open as many windows simultaneously as you like. The logs can also be printed or saved into text files, using the buttons at the lower right corner of each window.
For some logs, the additional button Open with “Console” will be shown. This applies to logs which macOS doesn’t store as readable text in the clear, but in machine-readable form. TinkerTool System always tries to make this as readable as possible, but in some cases, the application Console (from the Utilities folder) can use internal know-how of Apple to refine the results even further. So as a test, you can additionally open a log in Console to check whether it is processed differently there. In some cases Console, in other cases TinkerTool System will produce better results.
If you assume that macOS has created new reports while TinkerTool System was running, click the button Rescan in the lower left corner of the sub-item to update the pop-up buttons accordingly.
Modern Logging and Tracing
In addition to classic logging where message lines are added at the end of several text files, macOS supports a modern log technology, based on databases. They contain structured, compressed records which are distributed between files and main memory, depending on case.
Apple sometimes uses the term Unified Logging for this modern technology. It is designed to replace and supersede all previous logging methods, such as text logs, syslog, or ASL (Apple System Log).
The structure of today’s applications create new challenges:
- Programs are separated into different processes, e.g. to handle privileges more safely.
- Processes are divided into different threads, to distribute work onto multiple processor cores.
- Threads might be executed in parallel or in random order, unknown in advance.
When trying to diagnose problems with applications by the use of old-fashioned text reports, it can become difficult or even impossible to track related events between all those processes and threads. Their problem messages might have been recorded in chaotic order and it might not be clear how they are connected with each other. Generating text lines with detailed diagnostic information (which might not be needed under normal circumstances) puts the applications and the operating system under unnecessary stress.
macOS tries to solve these problems by establishing techniques which are more appropriate for current applications:
- Instead of using text files, logging and tracing information is recorded in high-performance databases.
- Applications no longer need to prepare complex text lines themselves (e.g. by computing a textual presentation of a network address which should become part of an error message). They can send such data in raw form to a central logging component. The component can later create the text on demand, if and when it is actually needed. This way, the decision to generate text and to format diagnostic data is postponed as far as possible. In many cases, the data can just be discarded after some time, without ever being processed.
- The same technology is used on all system levels. The inner system kernel uses exactly the same technology as a high-level application with graphical user interface.
- There are system-wide severity levels that define how important a message will be. Unimportant messages that are only useful for debugging purposes can be hold in memory for a short, limited time instead of saving it permanently to files. Discarding, archiving and cleaning of logs can be controlled more precisely.
- Messages can be associated with so-called activity identifiers. They make it easier to track which messages belong to a certain operation in the system, even if the computations needed to execute that operation are distributed onto several processes and threads.
- The log entries in the database can be enriched with additional information. When logging data is needed to fix a problem, database filtering can be used to find the necessary information, hiding all entries which are unrelated. So-called subsystem identifiers and category identifiers can be used to organize log entries.
- References to user data which could be critical for the users’ privacy can be removed before processing or storing them in the log database. This makes it easier to share logging data with technicians, avoiding the risk that private information or trade secrets are accidentally transferred to unauthorized individuals.
Activities contain a short clear-text description together with a numeric identifier. TinkerTool System shows an activity identifier as hexadecimal number with 16 digits. What to identify as separate activity and how to describe it is left to the author of the application that created an activity record.
Subsystem and category identifiers are also defined by the individual applications. So if you like to filter log messages associated with a specific software component, you’ll need information from the software developer what identifiers to use. Subsystem identifiers should be used to define a location within a program, e.g. a specific module. Category identifiers should be used to define a certain mode of operation, e.g. “test mode” or “network-related.”
TinkerTool System automatically analyzes your current operating system and tries to “guess” some of the most important subsystem identifiers. The names appear in the combo box at Filter by macOS logging subsystem identifier and can be selected as menu items. You can also overwrite the entry field and enter any other valid name not listed here.
macOS uses five different levels to define the role or severity of a log message:
- Fault: a message reporting an error situation that affects the entire operating system or multiple components of a software product.
- Error: a message for a problem that is related to a single software component only.
- Default: a message which does not indicate an abnormal behavior, but is still so important that it might be worth noting it in the log.
- Info: a message of purely informational nature. Such messages are not stored permanently by default. They are usually retrieved on specific request only.
- Debug: a message which is only of interest for software developers, helping to track the behavior of a program at the source code level. Such entries are suppressed by default and may occur at very high frequencies, e.g. several hundred log items per second.
TinkerTool System can be used to either
- extract selected entries from the live logging database or from an exported archive, converting them to readable text which can be shown and saved, or to
- export selected or all entries from the logging database, so that they can be reviewed on a different computer.
Apple has defined a specific file format, the macOS Log Archive with the name extension logarchive to transfer logging and tracing data between different macOS systems. The archives cannot be used directly with previous system generations (OS X or Mac OS X).
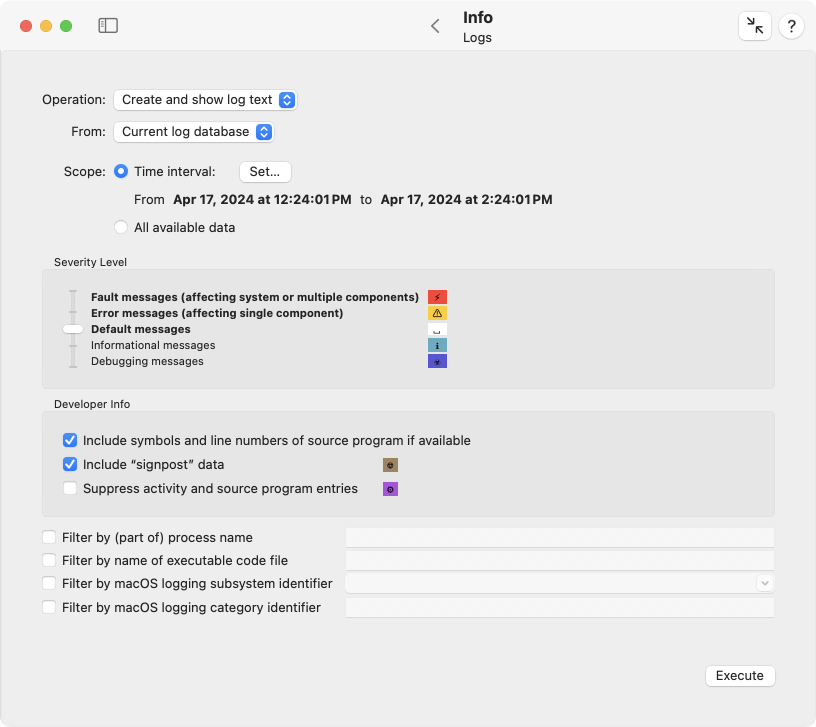
To work with modern macOS logs, perform the following steps:
- Open the sub-item Logs of the pane Info.
- Select the Operation that should be executed. You can either create and show log text or export log data.
- Select the source for the operation (if applicable). This can either be the current log database of the local computer or imported log data taken from a macOS Log Archive file.
- Use the buttons Scope to select the time interval that should be considered. Either you can specify a specific time interval via the Set… button, or select all available data. The time interval can be set with the From and To calendar/clock elements. You can either move the clock handles or enter the time as text. The button +12h can be clicked to quickly switch from AM to PM or vice versa, respectively. You can also set a pre-computed time as explained below.
- Choose the Severity level with the slider. A lower level includes all messages of all higher levels, which is visualized by using bold labels.
- If you like to add information for software developers to the log when available, set the respective check marks at Developer Info.
- Enable or disable the filter options you need.
- Click the button Execute.
By default, TinkerTool System will choose a time interval that includes the last two hours before the application was launched. If you don’t restrict the log by additional filters, this interval might be too large, because typically more than 2 million events are recorded within this period. If you know when a certain event happened you are interested in, you can set an appropriate interval via the time entry sheet with the box …or use precomputed time.
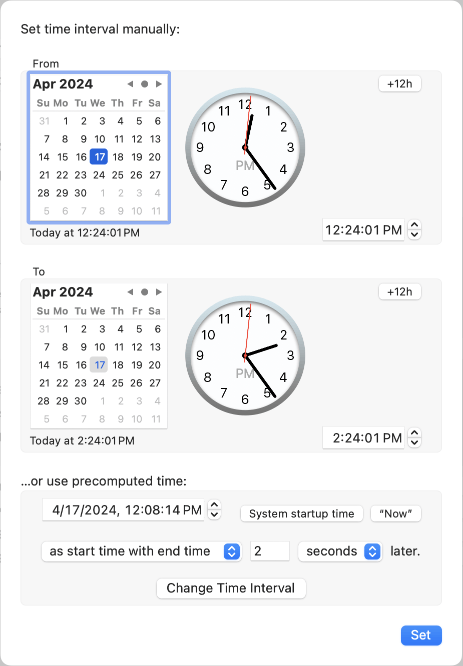
There, you can enter date and time of an event manually, and let TinkerTool System set a window between 1 second and 999 minutes around this event automatically. The characteristic point in time can be chosen to be the beginning, the end, or the center of the interval. You can also set the system startup time or the current time (button “Now”) by mouse click.
To use a filter, enable the respective check mark, then enter the name or identification for this filter into the field right next to it.
It is not recommended to let TinkerTool System generate very large log texts. The system may have problems to format and show such a long text in a standard window within an acceptable time. For this reason, the application automatically limits text reports to 500 megabytes of processed raw data.
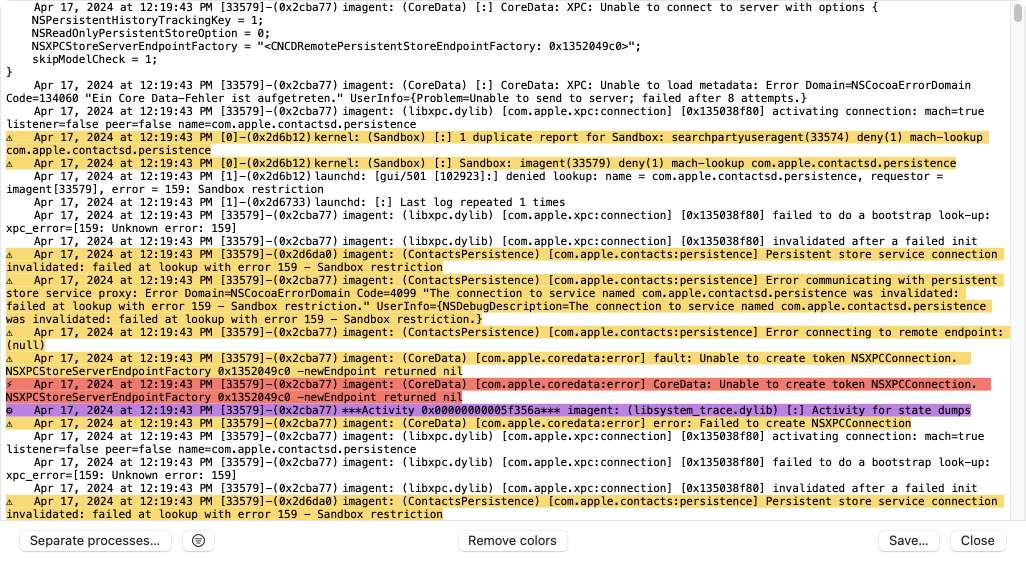
TinkerTool System uses the small icons and background colors shown next to the controls to also mark messages with the corresponding severity level or activity messages in the result text. The icons are shown at the beginning of the associated line. You can remove all color markings by clicking the button Remove colors. This cannot be reverted.
A black bar in the log text indicates that the macOS logging subsystem has removed some information from the output, because the application which had logged the message did not explicitly confirm that the text can be considered public. The removed part might contain data which could affect a user’s privacy or could otherwise be subject to data protection. This behavior ensures that log excerpts can be transferred to third parties, respecting national data protection laws. TinkerTool System cannot make these “censored” parts visible. If you remove colors, the black bars will be shown with the text private.
If you have activated the option Include symbols and line numbers of source program if available and the respective information is included in a log entry, this data will be added with a marker
>>> source:
at the end of the message line. “Signpost” events are marked by a brown background. In addition to their actual text they contain an indicator of the pattern
[spid 0x123456789, ABC, DEF]
where the number behind spid is the hexadecimal signpost identifier, followed by a scope and a type specification.
You can save the generated log text by clicking the button Save… in the display sheet. It will be stored in Rich Text Format (RTF), so it can be opened by any professional text editor, like TextEdit for example. To search for text in the logs, use the Edit > Find menu items or press ⌘ + F.
If the log text is very long, but you know roughly what you are looking for, you can establish a belated text-based filter in addition to the plain find feature. It allows you to focus on specific message lines, hiding all others. To do this, click the button with the filter icon at the bottom left. In a dialog window, you can now define and apply a key word to search for. After that, only the lines which contain the search term will be shown. Another click on the filter button makes the hidden lines appear again.
By using the button Separate processes…, it is possible to isolate entries for individual process instances that are of particular interest from the overall log panel, displaying them in separate windows. After clicking, a dialog appears in which you can select the process instances that have been detected. The program name is given in each case, followed by the process identification (PID) within parentheses. After selecting the processes to be displayed, each instance will be shown in its own window. In order not to overload macOS, the simultaneous output is limited to a maximum of 40 windows.