Monitoring Charge and Discharge Behavior
When Battery Monitor is running, all operational data about the battery will be continuously recorded each minute. This makes it possible to monitor behavior of the battery over a longer time interval using curves in a diagram. The following graphical evaluations are available:
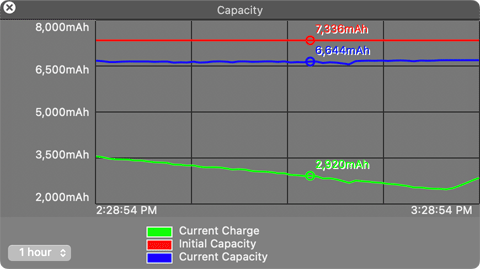
History “Capacity”
In this diagram, the current capacity (the charge state), maximum capacity and original capacity (see battery health) can be compared to each other. The charge and discharge curves of the battery can be monitored precisely. To open this diagram, select the menu item Window > History “Capacity” or press ⌘ + 3. By changing a preference setting, you can select either mAh or % as unit for the curves.
History “Current”
This diagram shows the history of the current flowed over time. You can use the curve to monitor how much power your computer has been drawing from the battery. This can help to identify “power guzzling” applications or devices (screen backlight, WLAN transmitter, external hard drives, etc.), controlling better how the electrical energy is being used during the day. The display can be opened by Window > History “Current” or by pressing ⌘ + 4.
History “Power”
The curve named “Power” visualizes the power the battery has delivered over the monitored time interval, or the power it has been charged with, respectively. Similar to the history “Current”, this display can also help to identify the electricity consumers in your computer. The power values basically summarize the voltage and amperage histories. The graphic is displayed after selecting the menu item Window > History “Power” or by pressing ⌘ + 5.
History “Voltage”
In this panel you’ll find the total voltage measured at the battery unit, either with the AC adapter connected or not. The diagram will be shown after selecting the menu item Window > History “Voltage” or by using the key combination ⌘ + 6. When using a virtual key in the Touch Bar to open the window, it will be identified as Vt for “voltage, total”.
History “Voltages (Cells)”
This graph shows the individual voltages of each of the cells in the battery unit. In many cases, this diagram can be used to assess if one of the cells is possibly defective, because such a cell usually behaves differently over time compared to the other cells. The diagram will be shown after selecting the menu item Window > History “Voltages (Cells)” or by using the key combination ⌘ + 7. When using a virtual key in the Touch Bar to open the window, it will be identified as Vc for “voltage, cells”.
History “Temperature”
The temperature readings from the battery, as measured by the main sensor of the battery controller. To open the history graph, select the menu item Window > History “Temperature” or press the key combination ⌘ + 8. The window automatically uses your preferred temperature unit.
Aligning History Windows
If several history windows are on screen at the same time, it can be useful to put them either on top of each other or to align them vertically, making it easier to inspect matching points on the curves. Select the menu item Window > Superimpose History Windows to let the graphs display “front to back”, utilizing the transparency of the windows. Select the menu item Window > Stack History Windows, or press ⇧ + ⌘ + T to collect the windows top-down aligned on the right half of the screen. Sizes and positions will be set automatically. The App tries to keep your previously chosen top-down order when doing so.
When using automatic alignment, it is helpful to also enable the feature History windows: Synchronize time axes for all windows in the settings.
Opening or Closing all History Windows Simultaneously
If your monitor screen is large enough to work with all history windows at the same time, you may like to open and close them all together. For opening them, select the menu item Window > Show All History Windows or press ⇧ + ⌘ + H. For closing them, select the menu item Window > Close All History Windows or press ⇧ + ⌥ + W.
Matching Selected Time Events
To exactly match a specific point in time between the different history windows, synchronization markers can be shown in the graphs. This is particularly useful when you have set different time intervals for the windows.
Click on any point in the graph area. Little circular markers will appear on all curves in all history windows that specify the selected point in time. In addition, the actual readings at that point in time will be shown. To remove the markers and the detail values, click into an area of any of the history windows outside the 4x4 box.
Hint: You can also drag the marker along the curve. It is recommended to switch the history windows to conventional style in this case, using Settings > General > History windows: Use standard windows, in order to avoid that the window moves while you drag.
Additional Notes
As mentioned already, the readings can only be captured and recorded while the application Battery Monitor is running. If the windows of the application are visible or not, won’t play any role. If your computer is switched off or is in sleep mode, no values can be stored. This will become apparent as gaps in the curves. If you like to monitor the behavior of the battery as continuously as possible, it will be recommended to let the application launch automatically and not to quit it.
The scale of each diagram will be determined automatically in horizontal and vertical direction, zooming into the curves to reach a presentation as clear as possible. You can review up to 12 hours into the past, while time is advancing from the left to the right in the diagram. This means present time is shown at the right border, while the past is visible to the left. The time interval to be shown can be controlled by the pop-up menu in the lower left corner of the window. You can choose between 1, 2, 4, 6, 12, 24, and 48 hours.
When launching the application for the first time, the graphs will be empty because no readings have been recorded yet. After approximately 2 minutes, the first curves will appear in the history panels. When you quit the application, readings already recorded will be kept. After you have relaunched the program, data which has been recorded within the previous 48 hours can still be monitored.
If needed, you can transfer the recorded values to other applications.