The Processors Window
To open the Processors window, select the menu item Window > Show Processors or press the key combination ⌘ + 6.
The Processors window shows detailed data on energy and power measurement for the computer’s processor chip. In addition to the individual power values, the window also lists data on utilization, used clock frequencies and sleep states, as well as other technical information. The presentation differs depending on whether an Intel processor or Apple processor is used.
Computers with Intel processors
The first line of the window indicates the official designation of the processor and its nominal clock frequency. The availability of logical cores (threads), physical cores and their distribution onto chip packages is also mentioned. Further information on these terms can be found in the chapter Power Overview window.
The upper section also contains the following data:
- Effective frequency: the virtual average frequency taking both, the actual clock frequencies and the time in which the computing units were used into respect. For example, if a processor with 1000 MHz clock speed was only busy (= switched on) during half the measurement time, it will have an effective frequency of 500 MHz. This value is also specified as percentage in relation to the nominal clock speed of the processor.
- Total power: the total power over all processor chips in watts during measurement
- Thermal state: the relevant temperature during measurement time. Detailed explanations can be found at the end of the chapter Power Overview window.
- Activity in “Last Level Cache not flushed” state: The amount of time during measurement where the chip was not in a sleep mode in which it would have been necessary to transfer the contents of the internal processor caches to RAM.
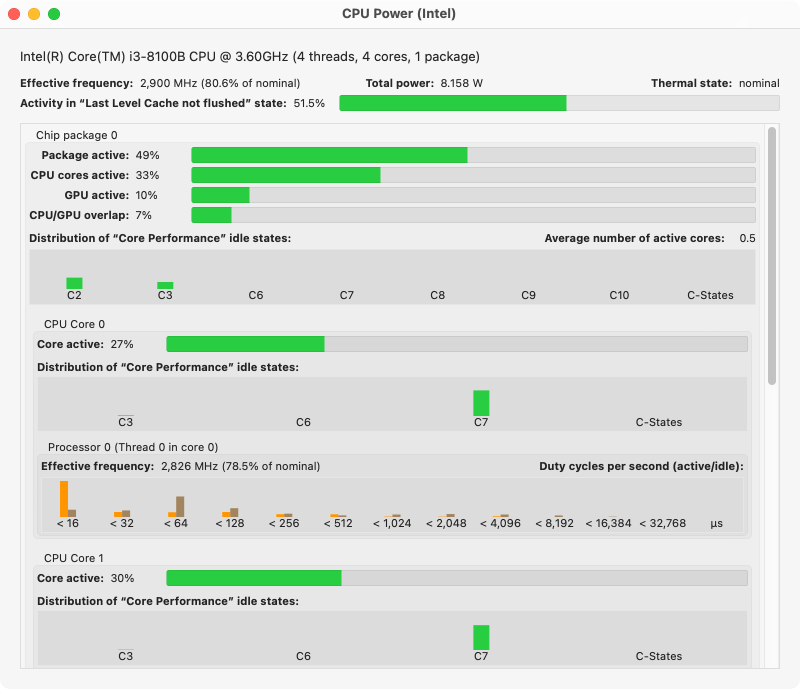
The lower part of the window is divided into subsections, which list the measured values for the individual CPU cores, as well as for the entire chip package:
- Package active: The proportion of time in which the chip was active.
- CPU cores active: The proportion of time in which at least one CPU core was active and switched on during measurement.
- GPU active: The proportion of time in which at least one core of the integrated GPU was active and switched on during measurement.
- CPU/GPU overlap: The proportion of time in which CPU and GPU were active at the same time.
- Distribution of “Core Performance” idle states: a graphic that shows in which C-states the chip had been during measurement. C-states are Intel-defined operating modes that characterize which parts of the chip are switched off when its processors are idle. The exact definition depends on the type of processor model. Further information can be found in Intel’s technical literature on the respective processor technology.
- Average number of active cores: The average number of CPU cores that were active during measurement.
The values for processor activity and its C-states are also listed separately for each core. In addition, the effective frequency is given again for each thread, i.e. a logical processor of this core.
The section Duty cycles per second indicates, divided into active and idle, how long a logical processor was or was not busy, by indicating this via a bar chart that compares the respective typical times of residency relative to each other. The times are listed on a logarithmic scale in microseconds. For example, if a bar with 50% height for “active” is specified at “< 32 μs”, this means that half of the jobs executed have occupied this logical processor for a period of less than 32 microseconds, but greater than 16 microseconds.
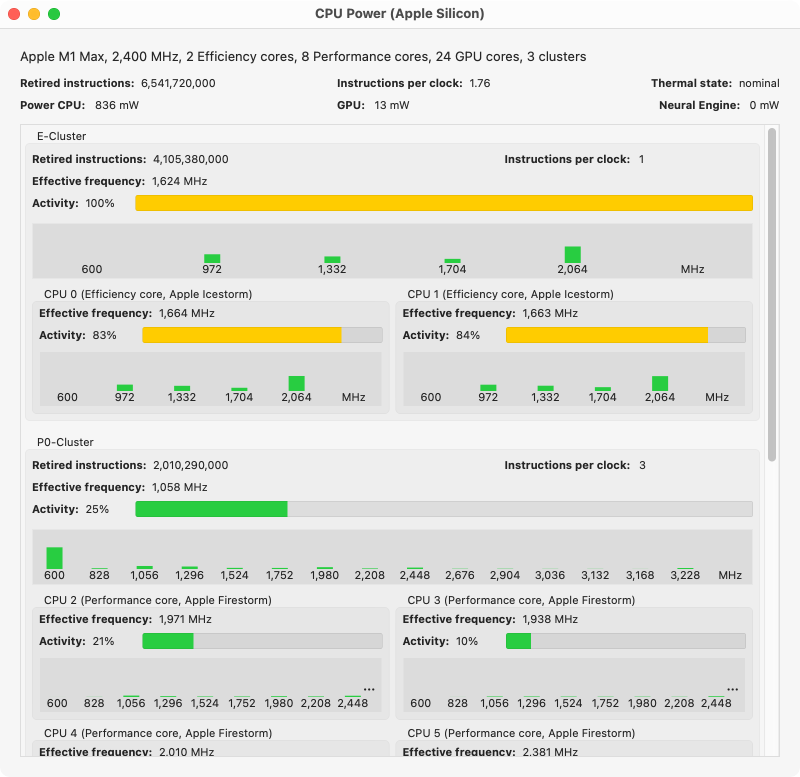
Computers with Apple Silicon
The first line of the window indicates the official designation of the processor and its nominal clock frequency. The availability of efficiency cores, performance cores, GPU cores and the grouping into clusters is also listed. Further information on these terms can be found in the chapter Power Overview window.
The upper section also contains the following data:
- Retired instructions: The total number of processor commands that all processor cores executed during measurement. Instructions which were only processed speculatively and then discarded, have been subtracted already. These are considered “incomplete” and are not counted.
- Instructions per clock: The number of commands processed on average per clock cycle.
- Thermal state: the relevant temperature during measurement time. Detailed explanations can be found at the end of the chapter Power Overview window.
- Power: the power in milliwatts recorded during measurement time, separated into CPU, GPU, and Machine Learning hardware (Neural Engine).
Apple does not provide the “instructions” readings for all combinations of processor models and operating system versions. In such cases, the corresponding fields won’t be shown in the window.
The lower part of the window is divided into sections for each cluster. It also indicates which processor core is located in which cluster.
Each cluster is presented via a box titled with Apple’s official abbreviation, for example P0 for the first cluster with performance cores. In addition, the aforementioned readings for retired instructions, instructions per clock cycle and power are indicated for this cluster. The following data is listed for the cluster and also for each processor core in this cluster:
- Effective frequency: the virtual average frequency taking both, the actual clock frequencies and the time in which the computing units were used into respect. For example, if a processor with 1000 MHz clock speed was only busy (= switched on) during half the measurement time, it will have an effective frequency of 500 MHz.
- Activity: the utilization, i.e. the ratio of time per measurement time in which the object was actually in use
- a graph with the ratios of the actual clock frequencies the units were operated with. If a processor core is underutilized, its clock frequency is reduced from the nominal clock frequency to save energy.
For each processor core, Apple’s code name is also mentioned, which characterizes the technology and instruction set of this processor.
Some Apple Silicon processors support a feature where all processor cores of an entire cluster are shut down in idle mode to save energy and to avoid heat. If such a cluster is detected, the additional indicator Switched off will be shown in the upper part of the respective cluster box. It shows the ratio of time per measurement time where the cluster was powered down.