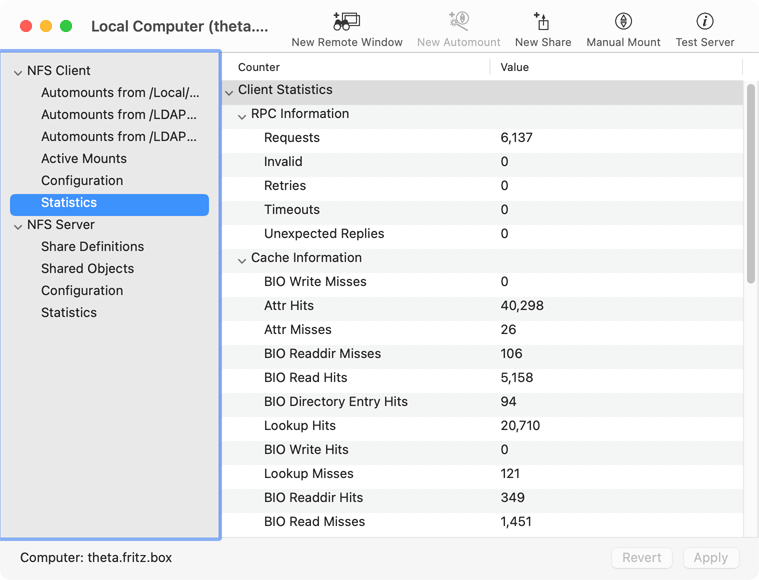
Monitoring the NFS Client
macOS keeps internal statistics about all characteristics which could be interesting to monitor performance and features of the NFS client. The collected data can be shown by selecting the item NFS Client > Statistics in the left overview column of the control window. The hierarchical table Client Statistics appears.
NFS Operations
The NFS function calls sent by the client to the NFS servers can be found in the lines containing the word Calls. The behavior of RPC communication between client and servers and the reliability of the network connections can be monitored by the lines containing the word RPC. The use of memory buffers (caches) is described by the lines with the word Cache. A cache hit indicates that a costly network communication could be avoided because the requested information was already/still available in memory. A miss indicates the remaining cases, where the cache could not be used for acceleration.
The readings are updated continuously. The counter values represent the number of events recorded since the operating system has been started.
Network Lock Manager
The Operations table includes a section related to communication with the Network Lock Manager (NLM) of NFS. You can observe how often an exclusive lock has been set, released, or tested for a particular object.
Responses to the NFS Client
You can also view statistics about the responses received by clients to requests made to NFS servers. To do this, select the tab Responses. A successfully completed operation is represented in the table as No Error. All other server responses indicate an error state and are recorded in the table along with their respective messages. Note that there is a distinction between general NFS errors and those specific to the NFSv4 protocol.
It is entirely normal for errors to occur during file access operations. For example, macOS may perform a test to verify whether a file shown in a Finder window still exists or has been deleted since its initial display. If the file has actually been deleted, the server should return a status message indicating No such file, which is the correct and expected behavior.