The Interrupt Distribution Window
To open the Interrupt Distribution window, select the menu item Window > Show Interrupt Distribution or press the key combination ⌘ + 5.
The Interrupt Distribution window shows how the processing of incoming interrupt requests has been distributed to the various processor cores. The presentation differs slightly depending on whether an Intel processor or an Apple processor is used.
Basically, the location of processing is indicated together with the type of interrupt and the number of observed events per measurement period. This number is additionally presented via a bar graph in relation to other and past readings, so that changes become quickly visible.
Interrupt distribution: Computers with Intel processors
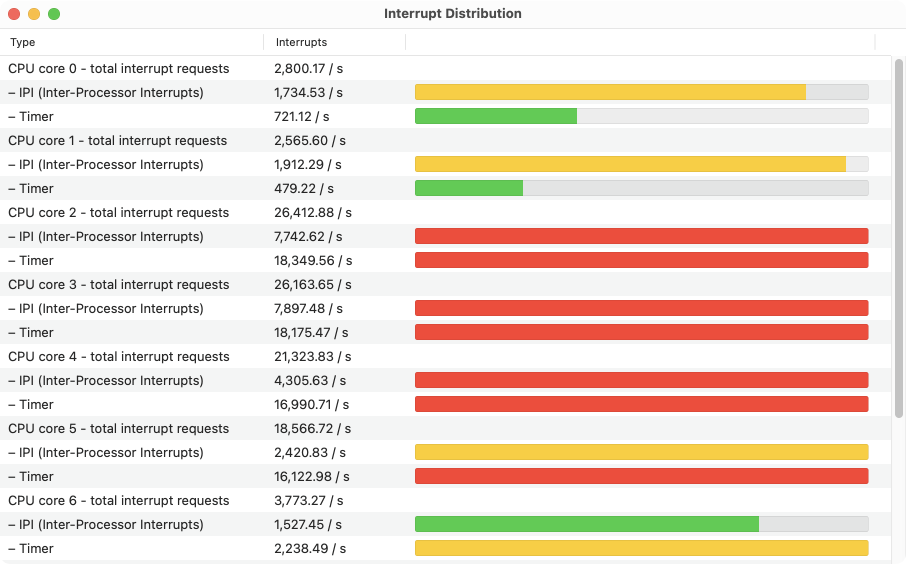
On a Macintosh with Intel processor, the first processor core (at index 0) traditionally takes precedence in the processing of interrupt signals. The most important two interrupt types are IPI (inter-processor interrupts, signals between two processor cores) and timer (timed wake-up signals).
Detailed values are also available for various other interrupt sources. The respective abbreviation of the hardware unit that sent the interrupt signal is specified. The abbreviation PMI refers to Performance Monitoring Interrupts. These are interrupt requests that were necessary to collect performance statistics (i.e. due to the measurement itself).
Interrupt distribution: Computers with Apple Silicon
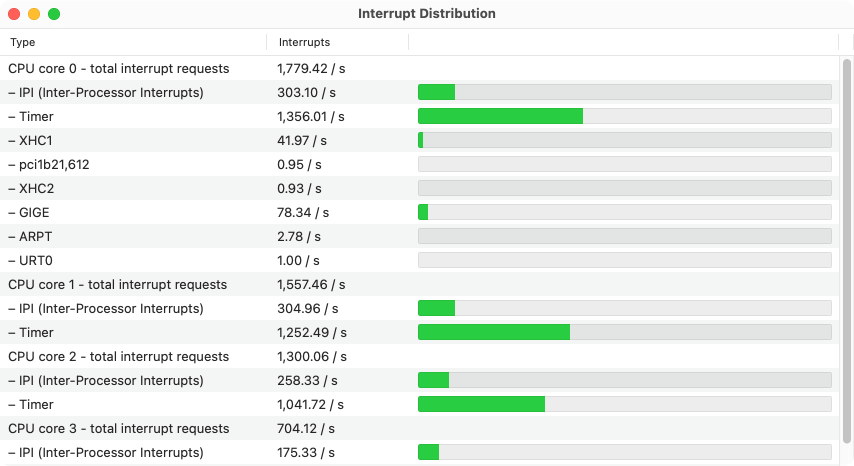
On a Macintosh with Apple Silicon, incoming interrupt requests are distributed relatively evenly among the efficiency and performance processor cores for processing. Details are only available for the two interrupt types IPI and Timer, which have been explained already.