The Processes Window
To open the Processes window, select the menu item Window > Show Processes or press the key combination ⌘ + 2.
The window contains a table of all processes that ran during measurement. The internal process name and a unique process identification number (PID) are always specified. All other columns of the table can be enabled or disabled, which is described in the next section. It is also possible to sort in ascending or descending order for all columns where this makes sense. To do this, click on the heading of the respective column.
In addition to running processes, the following two pseudo-entries can also be found in the table:
- kernel_task: a virtual process that summarizes the activities of the operating system kernel and its device drivers
- DEAD_TASKS: a virtual process that summarizes the activities of all processes that were newly added or terminated during measurement, so that their data could not be fully collected. The process identification is represented by the invalid number –1.
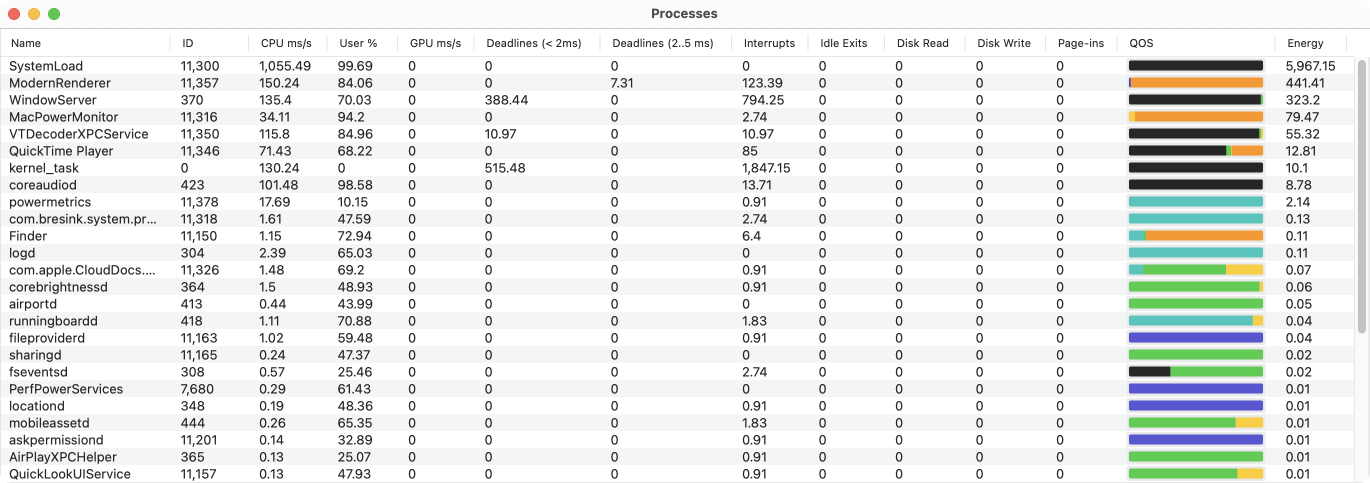
The table identifies the columns of the individual process measurements with the following headings:
- Name: The name of the process or pseudo-process.
- ID: The identification number under which macOS currently manages this process.
- CPU ms/s: The time observed per total time of measurement where the process used one or more CPU cores. The value is given in milliseconds per second.
- User %: The proportion of computing time consumed where the process has executed its own code in the user space of the operating system, as opposed to the time where the process indirectly used privileged services of the system kernel.
- GPU ms/s: The time observed per total time of measurement where the process used one or more GPU cores. The value is given in milliseconds per second.
- Deadlines (< 2ms): The number of wake-up operations during measurement where the process was woken up by timers which had a deadline of less than 2 milliseconds.
- Deadlines (2..5 ms): The number of wake-up operations during measurement where the process was woken up by timers which had a deadline between 2 and 5 milliseconds.
- Interrupts: The total number of wake-up operations during measurement.
- Idle Exits: The number of wake-up operations during measurement that led to the processor chip having to be switched back out of a power saving state.
- Disk Read: Number of bytes read by disk-like devices during measurement
- Disk Write: Number of bytes written on disk-like devices during measurement
- Page-ins: Number of storage operations bringing swapped-out memory back to main memory during measurement
- QOS: The distribution of priorities of the threads of this process during measurement. The priority is considered by macOS as a quality of service value (QOS) and is used to decide which thread may displace other threads when scheduling execution on the individual processor cores if the threads request computing time simultaneously. The colors and the individual QOS levels are listed at the end of this chapter.
- Energy: A value that symbolizes the amount of energy spent on this process compared to other processes during measurement.
Additional options for the process window
You can choose which data you like to retrieve when listing the processes in the table:
- Select the menu item View > Show View Options or press the key combination ⌘ + J.
- Check or uncheck the options at Display the following items.
- Click the Close button.
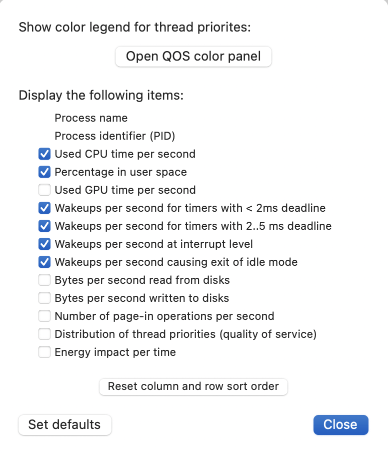
You can change the order of the columns by grabbing a column by its heading cell and dragging it to another position.
The column by which the table is to be sorted and a reordering of columns can be switched off together. To do this, click the button Reset column and row sort order in the dialog sheet.
To reset the entire table to standard values, click the Set defaults button.
Colors for displaying thread priorities (Quality of Service)
macOS internally uses the following gradations of priorities to define a quality of service for a task to be completed:
- Disabled: for technical reasons, no priorities are used
- Maintenance: a non-critical maintenance task should be carried out
- Background: a background function should be executed
- Utility: an auxiliary function should be executed
- Default: the task should be completed with normal priority
- User-initiated: the user has started the execution of a longer task and is waiting for completion
- User-interactive: the user works interactively with a program feature, so quick responses are expected
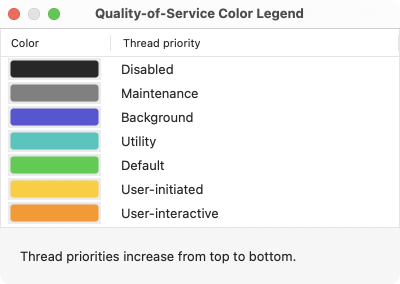
The colors used by the process window to present priority distribution in the QOS column can be shown in a second window:
- Select the menu item View > Show View Options or press the key combination ⌘ + J.
- Click the button Open QOS color panel.