Monitoring Network Interfaces
Network: Introduction
System Monitor can monitor the current performance values for network interfaces used by your computer. The current sums of the received and sent data of all selected interfaces are displayed in the menu bar in this case. All interfaces that are currently switched on, connected to an active network, and using an IP address will be considered. In addition to physical interfaces, this could be simulated interfaces as well, e.g. from virtual machines installed on your computer.
If you like to monitor the network interfaces of your computer, perform the following steps:
- Ensure the control window of System Monitor is open.
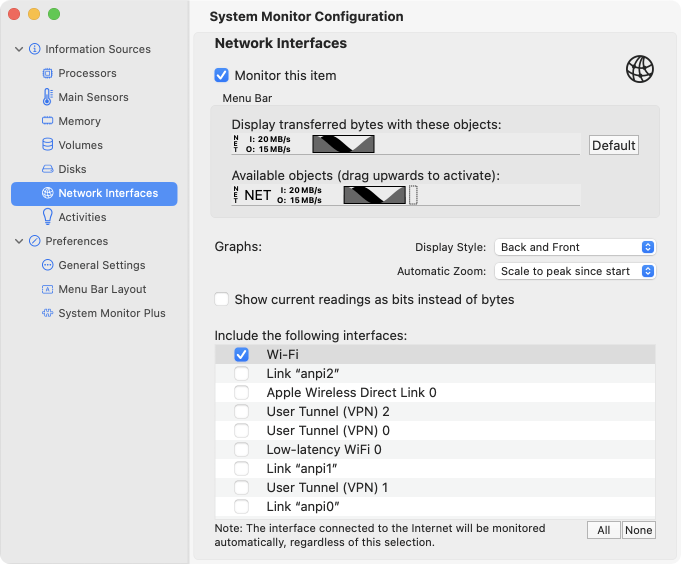
- Select the item Information Sources > Network Interfaces in the sidebar.
- Make sure the check mark Monitor this item is set at the right side of the window.
Only those interfaces will become part of the statistics which you have selected for monitoring. In addition, the interface currently connected to the Internet will be included (see below).
The data shown is calculated live and updated about once per second.
Network: Menu Bar
The box Menu Bar controls in which form network performance should be displayed. System Monitor offers a variety of icons and functions that you can combine in any order. The following elements can be used:
- The label NET (network) in small, vertical print to designate network performance values and to separate them from other icons in the menu bar.
- The label NET in large, horizontal print.
- The display of incoming (I) and outgoing (O) data on the interfaces as plain text in two lines using small print.
- The display of incoming and outgoing data rates as history for the last 30 seconds.
- A spacer to put more room between items.
Within the box, the upper bar simulates as a sample how this monitor section should be presented in the menu bar. You can grab the individual items by mouse and move them into a different order. You can remove an element by pulling it out of the bar. The lower bar contains the stock of items available. If you like to add a certain item to the menu bar, use the mouse to drag it from the lower to the upper bar. Pressing the button Default causes your current settings to be deleted, replacing it by a default suggestion for the menu bar.
Spacers are shown with dotted rectangles to make it easier for you to recognize and to move them. In the actual display, the rectangle will become invisible, so the spacer does its job providing a blank area within the menu bar.
If you mistakenly have removed all items of this monitoring section from the menu bar, a three-star-icon (⁂, asterism) will appear as a placeholder. This ensures that you still can open the associated menu.
You cannot drag items directly into the real menu bar.
Network: Menu Items
At least the following items will be shown for each selected network interface as part of the menu associated with this monitor section:
- The name of the network interface as it is used by macOS. Both, the plain text name (e.g. “Ethernet 1”), and in parentheses also the internal abbreviation for this interface (e.g. “en0”) will be shown. If this interface is currently being used for connecting to the Internet, this fact will also be mentioned.
- The IPv4 and IPv6 addresses currently used by this interface.
- Incoming: the current data transfer rate for incoming data within the last second.
- Outgoing: the current data transfer rate for outgoing data within the last second.
- Packets in/s: the current data transfer rate measured in packets for incoming data within the last second.
- Packets out/s: the current data transfer rate measured in packets for outgoing data within the last second.
- Peak value in: the peak value for input data rate observed since the start of System Monitor.
- Peak value out: the peak value for output data rate observed since the start of System Monitor.
- Received: the total amount of data received since the start of the operating system.
- Sent: the total amount of data sent since the start of the operating system.
- Packets received: the total amount of data received since the start of the operating system, measured in packets.
- Packets sent: the total amount of data sent since the start of the operating system, measured in packets.
Network interfaces can have a high number of IPv6 addresses that serve different purposes. For example, some are self-assigned by the local computer (“autoconf”), others are only used for outgoing Internet connections during a short time period to guarantee your privacy (“temporary”). To see the roles of each of the IPv6 addresses, let the network menu opened and hold the mouse cursor more than one second over an address line. System Monitor will use a help tag (tool tip) to indicate the exact mode of operation for the selected address.
Network: Displaying history graphs
The history graph in the menu bar and the individual history graphs in the menu can be shown in different modes of operation. The following options can be set:
Display Style: If you select Back and Front, the incoming data rate will be displayed dark at the back, the outgoing data rate will be displayed lighter in front. If you switch to Opposed, the incoming data rate will be displayed in the lower half of the graphics, growing from bottom upwards, the outgoing data rate will be displayed in the upper half of the graphics upside down, growing from top downwards.
Automatic Zoom: The history will automatically focus on the value range observed in the presented 30 seconds. The curve will always be magnified to make the graph cover a certain area. In the mode Scale to peak since start, the curve will be magnified to a degree that the maximum of the curve will match the maximum of values System Monitor has observed so far. This is the “most honest” mode of operation: If the monitored values have found their level after some time, the peak in the graph will match the peak performance the monitored interface can provide. Small data transfer rates, however, can become invisible because they might be so small compared to the peak value that they can no longer be represented graphically. The alternative is the setting Magnify displayed interval. Here, the zoom factor will be tuned each second, attempting to always make the smallest details found in the last 30 seconds visible. However, the magnification can now switch back and forth unpredictably, with small changes leading to an exaggerated impression. Both settings have their advantages and disadvantages.
Selecting the unit for current readings
Especially when a network interface is connected to a wide area network, it can be desired to measure current data transfer rates not in bytes, but as bits, matching conventions which are typically used in telecommunications and signal processing. If you like to enable this feature, set a check mark at Show current readings as bits instead of bytes.
This selection takes effect both for the displays in the menu bar and in the menu itself. It does not take effect for specifications of accumulated values, however.
Selecting the interfaces to monitor
The table Include the following interfaces allows you to control which network interfaces should be monitored by the app and which shouldn’t. Set a check mark next to each interface which should be monitored and remove the check marks for interfaces where no monitoring should be performed. The selection can also be applied to all entries automatically, using the buttons All or None. The lines in the table can be dragged to a different sort order if desired. This order will then be used for the corresponding sections in the menu.
The interface currently connected to the Internet plays a special role: It will always be included, no matter which selection of interfaces you have chosen. If you like to monitor the Internet interface only, it won’t be necessary to set any check mark in the table. This feature is useful if you are traveling with a portable computer where the Internet connection is constantly changing, e.g. if you are connected via Airport initially, then switch to a dial-in connection via a UMTS stick or the modem function of an iPhone. System Monitor automatically adapts to your network environment.
Display of the public Internet addresses (WAN addresses)
In private networks, IPv4 network addresses not suitable for use on the Internet are being used very often. A device of the private network, specially equipped to provide this service, e.g. a home router, uses the feature Network Address Translation (NAT) or IP Masquerading to map such a private network address to a public address valid for the Internet. This means your IPv4 address in the Wide Area Network (WAN) can be different from the address of your active network interface.
In case you are using modern IPv6 technology, which no longer requires this mapping, each network interface usually has multiple IPv6 addresses for different purposes. For privacy reasons, only one of these addresses, which change in regular intervals, is used to send requests to the Internet.
For these reasons, it can be interesting to known which IPv4 and IPv6 addresses your computer is currently using to communicate with the Internet.
If desired, System Monitor can determine these WAN addresses. If this feature is enabled, the addresses will be shown in the menu of the network section. To install this, please use the section Preferences > General Settings.
If you are using an HTTP proxy server, System Monitor will show the addresses of that server.